This week, i sold PWEI shares in Portfolio SC1. I kept others stocks witch are CFK and DXPE.
The average performance of the portfolio for the last week was -17.33%, that was a very bad week.
Market value for this portfolio is currently 11 214$, a gain of 12.14%, the biggest draw down I experienced since I am running this portfolio with real money is -17.33%.
The portfolio is running since 11/04/05 and annualized return is now 51.33%
Tuesday, February 14, 2006
Thursday, January 26, 2006
Great software for day traders
Have you ever heard about TymoraPRO software?
Probably not, because it’s not well know. When visiting their website and taking a look at their software features and videos presentations, I was very impressed. This software rooks; it is really a paradise for day traders.
This software offers a detailed analysis of equities, forex and futures depth books (Great for tape reading); it offers nice charting tools, statistic analysis, and real time scanner like what trade-ideas offer.
They have a long list of features.
Here is a list of some of these features:
- Specialized Filters, Alerts, Indications, and Tools for Identifying Panic Market Trading Conditions and their Potential Reversal Points
- $ALRT and $ALRTT asset indicators gauge market strength and activity by analyzing quantity and types of alerts being generated by TymoraPRO
- Plots all Pivot Points and Intermediate Pivot Points on Chart, along with auto 2-day 50% retracement, Key Price Points, and VWAP
- Volume separated by UP and DOWN Volume on every timeframe
- Pivot Point Alerts as well as information on Pivot Point Zone Support/Resistance Probabilities
- Real-Time Opportunity Signals (High Probability Trading Alerts) includes such in-depth studies as Market Participant Profiling, Order Flow Analysis, and Trend Cycle Identification
- Tracks recent large block activity and if prints occurred at/above bid or offer
- Real-Time Alerts on Potentially Stock-Moving SEC Insider Trading Filings
These are some nice features among a huge list that TymoraPRO software offers to you.
The other great software from Yourika is TymoraRePLAY; that will let you save and replay complete Level 2 and T&S data.
Cost begin at 100$ per month for TymoraPRO and 10$ per month for TymoraRePLAY.
Wednesday, January 25, 2006
Stock market articles
I have found for you some interesting articles about the stock market.
They are all published in about.com website and they deal about different aspects of the stock market.
The first article deal with Earning estimates
The second one title is Understanding Earnings Season
The third one also deals with earning and is titled: Beating Earnings Estimates
And the last one that talks about earning is titled: It's the Earnings
Second series of articles are titled as follow:
What Moves the Market?
Stock Market Crash - Can the Stock Market Crash Today?
List of complete articles that deal with the topic: what make the market move?
Tuesday, January 24, 2006
Portfolio SC1 update (23/01/2006)
No change in Portfolio SC1 this week. I kept all my stocks witch are CFK, DXPE and PWEI.
The average performance of the portfolio for the last week was -2.65%, pretty the same as the indexes performance.
Market value for this portfolio is currently 12 113$, a gain of 21.13%, the biggest draw down I experienced since I am running this portfolio with real money is -11.51%.
The portfolio is running since 11/04/05 and annualized return is now 148.3%
Friday, January 20, 2006
Paper Trading
A great way to learn trading is to use software that let you simulate orders.
With your real time data, you can submit buy or sell orders; but theses orders are simulated; this is a way to learn trading without loosing money.
You can do that everyday, learn how stocks are reacting to news, to market, to volume… and construct progressively your trading system.
Some people are saying that learning with theses tools is a bad idea and it’s better to start trading real money to exercise your self but with few dollars.
I don’t really agree with them because I am sure that if you are going to develop a strict trading system and you will stick strictly to its rules; then you can learn trading by the simulation; that can be the first step in learning; the second one will be trading with real money but with a small account.
If you don’t have access to real time data or don’t have time to trade during market hours because of your work or anything else, then you can use software that let you playback old stock data. Here is how it works:
- You select for example 04/01/2006 intraday data for IBM stock and you select speed of execution, and then start trading.
Ensign window software has this excellent feature.
Thursday, January 19, 2006
How to trade pivot points?
Pivot points are common used by traders all over the world, theses points are working because floor trader are also using them; they act as resistances and supports.
Pivots point can be used in different time frames; they can be used daily, weekly or monthly.
Here is the calculation of theses pivot points
R2 = P + (H - L) = P + (R1 - S1)
R1 = (P x 2) - L
P = (H + L + C) / 3
S1 = (P x 2) - H
S2 = P - (H - L) = P - (R1 - S1)
Where H is high, L is low and C is close.
R1 is the first resistance, S1 the first support, R2 the second resistance and S2 the second support.
Look at this chart and how price is reacting near pivot points.
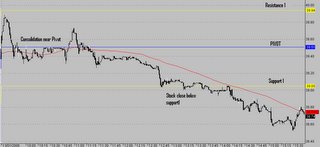
Apart from theses pivot points levels, there is other way to point resistances and supports.
- Using recent high and low
- Using yesterday high and low
- Using Fibonacci studies
- Using Woodie's pivot point
The best way to trade with pivot point is to look for bullish or bearish pattern with a confirmation of an indicator when stock is trading near pivot point levels.
Note that the high, low and close in 24-hour markets such as forex are often calculated using New York closing time which is 4:00 p.m. EST.
Wednesday, January 18, 2006
Portfolio SC1 update (18/01/2006)
No change in Portfolio SC1 this week. I kept all my stocks witch are CFK, DXPE and PWEI.
The average performance of the portfolio for the last week was 3.91%, which is a good performance; Indexes performance helped stocks to achieve this gain.
Market value for this portfolio is currently 12 443$, a gain of 24.43%, the biggest draw down I experienced since I am running this portfolio with real money is -11.51%.
The portfolio is running since 11/04/05 and annualized return is now 212.82%
Friday, January 13, 2006
Consider working with buy rules first
Suppose you want to build a trading system and you already have buy rules but still trying to found the best sell rules that make your system the most profitable. In order to not loose your time and to make sure your buy rules are correct, I suggest that you work first with an exit after N day as sell rule, you can vary N to make sure your system is profitable over different holding periods. If you found your system to be profitable then you came up with good buy rules and you can now begin working on sell rules, stops… If it is not the case then forget this system and start looking for another one.
A simple trading system that use a set of buy rules and a simple exit after N days, will show you if you use the right buy rules. A high percentage of profitable trades are very important and you should only consider system that showed the higher number of profitable trades.
Many times I came up with trading system that show a percentage of profitable trades of more than 65% and a negative performance with a holding period of 5 days and then after modifying sell rule, I improve this to 75%, sometimes more and get a nice return.
This is not always the case, but the most important to know here is that working with a system that show more looser than winner with a fixed holding period is a bad ideas, unless your system show great return.
Thursday, January 12, 2006
Tape reading for timing
Tape reading or the reading of moment by moment transactions in a stock is widely used by traders, institutional, professional and hedgers.
It can help them seeing in real time, the current consensus for a stock.
Tape reading consists of reading order books which contain the current bests bid and ask prices and their respective sizes.
Here is an example of an order book
66 9737 9 9738
55 9736 11 9739
40 9735 35 9740
52 9734 40 9741
38 9733 16 9742
9737 is the best bid, 66 is the size for that bid; 9738 is the best ask, 9 is the size for that ask.
Tape reading needs a lot of experience and practice; you must watch closely every day live order books for months and years.
It shows at what price buyers are willing to buy the stock and sellers are willing to sell the stock.
Tape reading is difficult, because order book flow is constantly changing, the more the stock is liquid, the more bid ask prices and sizes will change quickly.
Many traders will tell you that there aren’t enough resources on the net or even books that talk about tape reading, that is true and this is because tape reading need to be learn by experience.
But I have found a nice article in the CBOT web site that introduces tape reading, here is the link.
I found this resource useful especially for beginner.
Wednesday, January 11, 2006
Trading business plan
I have found on FutureMag some articles about building a trading business plan.
That will be your first step before building a trading system.
Theses articles begin with an introduction to the trader’s business plan then talk about markets mixing, learning, staying informed… Others aspects like finding a broker, software and hardware needs in future trading, and regulations are also covered.
I have read theses articles and found them very interesting, maybe they are more oriented to beginner traders but can be helpful to everyone.
A business plan is different from a trading system plan, this plan will help trader to stick to rules that are important for their long-term trading career, you will be able to identify your resources’ need, your potential problems and find suitable solutions that will help you became a profitable trader over the long-term.
Monday, January 09, 2006
Portfolio SC1 update (09/01/2006)
No stocks to buy this week for my portfolio SC1.
The last week was very profitable, the portfolio gain 9.29%.
Here are stocks in my portfolio SC1:
CFK is gaining 43.98%
DXPE is gaining 34.63%
PWEI is gaining 6.32%
Market value for this portfolio is currently 11 975$, a gain of 19.75%, the biggest draw down I experienced since I am running this portfolio with real money is -11.51%.
The portfolio is running since 11/04/05 and annualized return is now 184.28%
Friday, January 06, 2006
Is Put/Call Ratio out of date?
Put/Call Ratio is used as sentiment indicator, trader use it to gauge the strength or weakness of the market.
Data of Put/call Ratio are collected by the CBOE (Chicago board exchange), and is available at their website http://www.cboe.com.
There is two Put/Call Ratios, one for equities and one for indexes, it is computed by dividing the total put-options volume by the total call-options volume in the CBOE.
This ratio is widely used by investors that try to predict bull top and bear bottom, since a long time this ratio had a great success but in these days false signal are becoming more and more frequent.
Does it mean that this sentiment indicator is dead?
Because, too many investors use it, and you probably know that going with the crowd is a bad investing idea, this indicator may lost of its efficiency.
My personal point of view is that as soon as more and more investors will abandon this ratio, then it will be the moment to use it again.
Day-to-day volatility can be very erratic so using raw indicator is advice against.
Rather you should use moving average of Put/Call Ratio; 21 day moving average is widely used as 21 day is about one month in trading.
Try to download this ratio data on your favorite technical analysis software and make some back-test to convince yourself that this ratio is out of date.
And why not, maybe you can find something interesting that make my point of view faulty.
Thursday, January 05, 2006
Stock market rally and high interest rate are both benefic to US dollar
US stock market rally can be benefic for the US dollar; higher interest rates can also be benefic for the US dollar.
Theses two components, stock market and interest rates, are correlated to the US dollars.
In fact, when the stock market is rallying, it provides an ideal investment opportunity for traders, theses traders will buy more and more dollars to invested in US stock market; this will make the US dollars increases against others currencies.
When interest rates are higher then more foreign investors will buy dollars to profit from theses interest rates.
Imagine you have 1 000 000 Euros and you want to gain higher return but without too much risk; Interest rates in Euro is 2% and in USA 4.5%; will you convert your money to US dollars ? Of course yes.
To summary, Stock market rally and high, growing interest rates are both benefic to US dollars; the ideal is when they happen at the same time.
But of course this is not always the case, because growing interest rates is usually a bad news to the Stock market.
When for example stock market is rallying, interest rates are decreasing, US dollars are increasing and no others events happen, then forex traders are more focusing on stock market than the interest rates to take their investment decision.
The best way to trade currency I think is to focus on economic events to get a general market sentiment and then use technical analysis for timing. Following the trend in forex like any other market is very important.
Others economic events that you have to look to are us deficit, unemployment Rate, geopolitical events…
Wednesday, January 04, 2006
What kind of trading system are you looking for ?
The most popular term that contains “Trading system” and that people looked for on internet search engine was forex trading system.
Why? Probably because forex market is the most used by investors, it has a daily volume of more than 1trillion dollars.
After forex trading system, the next term is: stock trading system, then future trading system, then day trading system, then option trading system and finally swing trading system.
By these searches we can sort the popularity of each market and what most investors are looking for when it is about Trading systems.
Internet users has done about 13 500 searches for ‘forex trading system’ term per day.
To show you the popularity of the forex market; just after this first term, the next one which is ‘stock trading system’ was searched about only 1000 times per day on average.
Portfolio SC1 Update
Yesterday, i sold BTUI and bought PWEI.
My portfolio was again down for the week.
Return the last week was about -2.2%
Now, portfolio is invested with these stocks :
CFK
DXPE
PWEI
Portfolio current stock value is 10 957$, while the biggest draw down i experienced since i begin playing real money is -11.51%.
My portfolio was again down for the week.
Return the last week was about -2.2%
Now, portfolio is invested with these stocks :
CFK
DXPE
PWEI
Portfolio current stock value is 10 957$, while the biggest draw down i experienced since i begin playing real money is -11.51%.
Tuesday, January 03, 2006
Stock Split (Part 2)
Stock Split (part 1)
Back-test problems:
Lot of back-testing software provide feature to let you add stock split date in their data, so the software can adjust its quotes for every split you enter.
The problem is that you can’t add all split’s events in your software because that too much works and too many stock splits happen in the market. Just take a look at stock split calendar in some website to see how many stocks are going to perform a split in next days.
So, how to deal with this problem?
- Some software already incorporates stock quotes with splits, so all quotes should be adjusted.
- For other software that needs to connect to a free or paid server to download quotes, what you have to do is to choose a server than contains split adjusted data.
Example of paid website : http://www.historical-stock-data.com
- If you use quotes that are not split adjusted, then a final solution is to take all trades that performed more than +-20% (Maybe a split happen) and to make sure there isn’t any split that happened at the period where it was picked.
After that you can signal a split in your software or discard this stock to make the back-testing errorless.
Stock split strategy or trading stock split:
In another post, I will discuss about strategies that use stock split as buy or sell signals.
If you want to follow these stock splits, there is some website that publishes stock split calendar. Do a stock split calendar research on Google to find these websites.
I personally use yahoo stock split calendar.
Monday, January 02, 2006
Stock Split (Part 1)
Stock Split definition:
Stock split is a corporate action that increases the number of shares for a company but without any changes in stock’s market capitalization.
Imagine you own 10 000 shares of company X and each share worth 20$.After a 2 for 1 split, you will own 20 000 shares and each one worth 10$.
As market capitalization remains the same, there isn’t any change in the true value of the company.
There are many stock split ratios; the most common are 2 for 1, 3 for 2 and 3 for 1.
When do stock split?
Companies can decide to implement a stock split for many reasons.
One common reason is that when their stock price gets too high, it will scare off some small investors, also it will increase liquidity and reduce bid/ask spread.
Back-test problems:
When doing a back-test in some technical analysis software, you probably come up with some problems regarding stock split.
Lot of these software don’t incorporate stock split in their data and this will result in some error in the back-testing.
As an example:
Imagine a trading system back-test that picks Stock X.It buy X at 20$ and then sell it at 9$. (Loss of more than -50%)
In reality, there is a great chance that when the system picked the stock X, the company made a 2 for 1 split and that’s why the stock dropped from 20$ to 9$.
So in fact, the real result will be a performance of -10% (Buy at 10$ and sell at 9$).
The opposite can happen, when you see big gaps in stock chart, it is probably due to reverse stock split.
A 1 for 2 stock splits means that for every two shares you own, you get one share. It’s the opposite of 2-for1 stock split.
Saturday, December 31, 2005
Fire Your Stock Analyst, Book selection
Fire Your Stock Analyst
By Harry Domash
The author of the book describes some systematic approach to pick winning stocks, he describe the best techniques used by leading money managers.
These managers have beaten the SP500 over a long period with a track record.
The book focus on fundamental analysis, it includes screening for candidates, determining stock valuation, setting a target price and a lot of more tips.
The author didn’t forget to write about the most important part in trading which is when to sell.
I enjoyed reading this book, reading about how to evaluate qualitative data, especially management quality…
Finally, this book is suitable for beginner as well as intermediate investors.
Common mistakes in futures trading
First, estimates suggest than no more than 10% of individuals who trade commodity futures win money.
Others individuals loose money because professional are better trader than them.
Professional know everything about what happen in markets, they know everything about the commodity they trade and they have generally much more experience.
But the biggest reasons that make those individuals loose are due to some common errors.
Theses errors can be summarized:
- Lure of easy money
- Lack of trading plan
- Using too much leverage
- Lack of money management plan
- Lack of discipline
There is probably some others, but I wanted to point the most know.
Free live webinars and the process of learning
The key of success in trading is the process of learning.
You need to spend some hours per day learning new trading techniques, improving your knowledge, learning from your errors…
Trading learning is a very long process that never ends, it needs will from your side and also a lot of patience.
It’s while learning that you would become a better trader.
Error due while trading must also incite you to improve your trading by learning of course to avoid these errors in future.
There is a much better way to learn trading than reading books or articles, it is webinars.
I have some links of web site that offer free webinars.
If I found new free webinars in future, I will add them to my blog in others posts.
Here is two web site that offer free live webinars plus an archive of these webinars.
Interactivebrokers
Lind-waldock
You need to login first.
Friday, December 30, 2005
Real time scanner
I use since one year Trade-Ideas as a real time scanner.
It provides me with good patterns, and I am very profitable using them.
I developed some day trading systems using Trade-Ideas, you can find them at my other website www.day-trading.in
Some days ago, I wanted to take a look at others real time scanner, to make sure that the one I use is the best one.
First, it’s very hard to find one.
The only one I found is TradeScan.
Of course there are a lot of others, but generally they are implemented directly in a trading platform, as example the real time scanner of eSignal.
After a first look at TradeScan, I found that Trade-Ideas look more professional, provide more alerts, more filters, better price…
Now I am sure, I will stay with Trade-Ideas.
Please contact me if you find another independent real time scanner.
ER2 leading index
There is lot a correlation between indexes.
If Dow Jones Index moves, in most case SP500 and NASDAQ will also move in the same direction.
Let say, you buy ER2 (Russell2000 Future) when he break its resistance.
Do you think it’s necessary to pay attention to other indexes like YM, ES or NQ and look if they break their resistance too to confirm your trade?
You can do that, but you will probably miss a lot of moves.
I think that when trading ER2, you should not look at any other index because ER2 is the leading index.
ER2 moves often ahead of YM, ES or NQ.
When others indexes are moving upwards and ER2 go in the opposite direction, it’s generally a sign of market weakness.
I read a study about that, but I have to look at my bookmarks to give you the link.
I will probably make another post just for this study.
Thursday, December 29, 2005
Industry EPS and Moving Average
Do you want a simple screener with great results?
In the screener I will show you now, I only use one fundamental ratio and one simple technical formula.
Since 2001, this screener showed a total performance of 700% and annualized return of 51%.
It consists of buying stocks in growing industry (Fundamental Ratio).
Here is the description of this fundamental ratio (I will call it IndGrowth):
Percentage of change in current annual EPS of the industry as compared to the same period one year ago.
Formula: EPS for the most recent fiscal year minus the EPS for the same period one year ago divided by the annual EPS one year ago, multiplied by 100.
This data can be calculated easily or can be found in most know screeners, like Reuters screener.
Order all industries by high IndGrowth ratio.
Select about 20% of all stocks in us market from top industries.
Second Rule :
Buy top 20% from the previous list of selected stocks for this formula.
(Today close)/(200 day Moving Average).
When using these both rules as buy rules and selling stocks after one month, you can achieve the performance above.
Some additional buy rules to consider:
- Average dollar volume must be higher than 100 000$ per day.
- Stock price higher than 1$.
- Stock market capitalization must be lower than 500 millions dollars (micro and small caps).
This screener was back-tested for the previous five years.
NB: EPS is earning per share.
Watchlist for December 29, 2005
I will start a Watchlist post everyday.
This Watchlist will contain stocks that will be likely to go down.
I already made a back-test and it show that 62.5% of these picks showed a negative gain for one day. So, go SHORT with theses picks.The average gain for winners are pretty the same than average loss for losers and is about 6%.
Potential day trade for today:
AMIE
NB:
- Short theses stocks, don’t go long.
- Make sure theses stocks are shortable.
Wednesday, December 28, 2005
70% winners and an annual gain of 850%, but...
I developed two years ago a simple trading system that showed great results in back-test.
This trading system showed 70% winners and an annual gain of 850%.
I was very happy and was thinking i found the ultimate system.
Everything was correct and i double checked everything, but when i traded this system, it was clear for me that i the system cannot be traded :(
So first let me explain rules of this trading system.Its was a long day trading system.
The rules was simple :
- 10% of capital for each position.
- buy a stock when it's 5% down from the open price.
- Stock must have more than 100 000$ average dollars volume per day.
- some others rules but i forget them.
The important thing to focus on is the second rule.
Do you think its correct ?
Of course yes, but the back-testing results was completely incorrect because of something that happen all the time to stocks that don't have enough liquidity (stocks with 100 000$ average dollars volume per day is not a liquid stock).
With an example it should be clear :
A stock open a 10$, then after 1 hour it is at 9.98$, one minute after that it drop to 9.4$ (-6%) for a second then it come back to 9.98$.
What happen here is due to lack of buyers at that moment, a single sell order make the stock drop quickly but when that happen quickly a new buyer come and make the stock up again.
Of course you will not have enough time to buy at 9.4$, even at 9.5$ so you will miss the trade.
The back-test don't miss that trade and show a performance of about 6%.
When in a simulation lot of theses kind of trades are picked, this will mislead the back-test results.
Market sentiment is bullish but...
I was looking for articles and newsletters talking about these days short term market sentiments and i found that about 90% of them are bullish.
Even the survey about Investors optimism is on the rise.
Does that means that the market will rise in the next months ?
Probably not.
I don't know how the market is going to do in next weeks, but i know that if a majority of people are bullish then the majority of them are long.
So at this point more investors are likely to go short (selling their positions) than ones to go long, because the majority are already long.
I can't be sure about that, but i think that if the market don't run up quickly in next weeks then it can experience a drop and optimism can disappear with more and more investors selling their positions.
If you think i am wrong, please correct me.
Subscribe to:
Comments (Atom)
