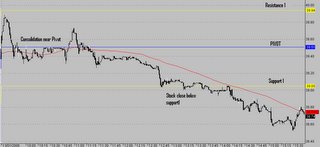
Pivots point can be used in different time frames; they can be used daily, weekly or monthly.
Here is the calculation of theses pivot points
R2 = P + (H - L) = P + (R1 - S1)
R1 = (P x 2) - L
P = (H + L + C) / 3
S1 = (P x 2) - H
S2 = P - (H - L) = P - (R1 - S1)
Where H is high, L is low and C is close.
R1 is the first resistance, S1 the first support, R2 the second resistance and S2 the second support.
Look at this chart and how price is reacting near pivot points.

Apart from theses pivot points levels, there is other way to point resistances and supports.
- Using recent high and low
- Using yesterday high and low
- Using Fibonacci studies
- Using Woodie's pivot point
The best way to trade with pivot point is to look for bullish or bearish pattern with a confirmation of an indicator when stock is trading near pivot point levels.
Note that the high, low and close in 24-hour markets such as forex are often calculated using New York closing time which is 4:00 p.m. EST.


