First of all, you know that there is hundreds or even thousands of theses kind of indicators in the market.
Each one use its a proper formula and its goal is to provide you with buy or sell signals.
Everybody can have its own interpretation of the indicator he use.
Generally, indicators tell you to buy a stock, future or any security if its value cross a defined level.
Also majority of indicators use what everybody call divergence, its when for example an indicator is falling (bearish) and a stock is rising, in such case, we said that the indicator is telling us to sell the stock because this kind of divergence is a strong signal of trend reversal.
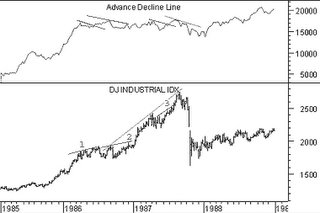
I took a chart that i found on the Internet and which talk about advance/decline indicator.
I don't want to say that its not a good indicator, i never really use it.
But like all others indicators, here is how web sites are promoting his potential.
Above is the chart of the Advance Decline indicator and below the Dow Jones index chart.
The lines drawn show the divergence followed by the big drop in Dow Jones index.
When you look at these kind of charts, you said wow, what a good indicator, i am going to use it right now.
Now its true that the signal given is really good. But i want to explain you here that you can find
a lot of others divergences in theses graphs and a lot of them give false signals.
Take a look at the same chart, i drawn some others divergences.
I exactly drawn three others divergence lines and you can see that the market didn't decline after divergence happen.
You can't find others divergences that give false signal in this chart.
Again, Advance Decline Line is probably a good indicator, but with this example, i wanted to show you how web sites try to mislead you with nice charts and focus only on profitable trades.
You can say if an indicator is a good one, only after you back-test it.
Remember that, it is a gold rule.


